The widespread use of Microsoft Teams makes it important for admins to keep track of Teams usage in the organizations. MS Teams usage report will provide admins the info on how many teams and channels have been created, how many messages have been sent, how many meetings have been held, etc. By analyzing the Teams usage report, admins can work on improving collaboration, integration, and productivity within the organization in a better way. This blog will help admins in finding the places where they can obtain Teams usage activity reports.
There are several places where you can find Microsoft Teams usage reports. To obtain, you can go to:
- Microsoft 365 Admin Center
- Microsoft Teams Admin Center
- Microsoft Teams Client
- Power BI
Teams Usage Report in Microsoft 365 Admin Center
To find the Teams usage report in the Microsoft 365 admin center, follow these steps:
Step 1: Open Microsoft 365 Admin Center.
Step 2: Navigate to Reports –> Usage –> Microsoft Teams.
There you can find usage reports on user activity, team usage, and device usage. To view this report, you must be assigned any one of the following permissions such as: Global admin, Exchange admin, SharePoint admin, Global reader, Usage Summary Reports reader, Reports reader, Teams admin, Teams communications admin, or User experience success manager.
- Microsoft Teams activity report lists the info on the number of active users, active guests, active teams, active channels, active devices, last active date, team type, number of posts, replies, chat messages sent by a user, and more.
- Admins can use this information to understand how Teams is being used and identify any potential issues with adoption or usage.
- Admins can use the filters at the top of the page to view data for a specific period of time (currently, you can see the trends for the past 7 days, 30 days, 90 days, or 180 days).
- Admins can also click on the Export data button to download the data as a CSV file for further analysis.
- Adding and removing columns can be made for better classification purposes.
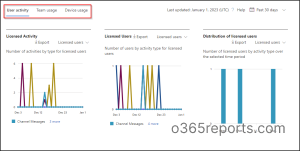
Teams User Activity Report – Here you can obtain insights on activities performed by users in Microsoft Teams. User activities include how many users post, reply, total 1:1 and group calls, and how many meetings a user organized, shared channels tenant name, etc. In this report classified graphs based on licensed activity, licensed users, distribution of licensed users can be seen.
Teams Usage Report – Team usage report in Microsoft 365 admin center fetches info on active teams and channels in the organization. With the usage metrics on active channels, guests in each team, and admins can also measure the internal and external collaboration among the shared channels. Additionally, with the last activity date for all teams in this usage report, admins can find unused teams. This report classifies graphs between channel usage and Team usage.
Teams Device Usage Report – Teams device usage report provides you with info about the devices used to access Microsoft Teams. Breakdown of users using Microsoft Teams using Windows, Mac, Web, iOS, Android phones, and Chrome OS can be fetched easily. Here, a detailed graph based on the number of licensed daily users by device type and for a specific time period is given.
Analytics and Reporting in Teams Admin Center
Here are the steps you can follow to view analytics and reports in Microsoft Teams admin center:
Step 1: Open Teams Admin center.
Step 2: Navigate to Analytics & reports –> Usage reports.
Access to the reports in the Microsoft Teams admin center requires: Either global admin, global reader, or Teams service admin privilege.
- The Teams usage reports in the Teams admin center provide detailed information on how Microsoft Teams is being used in your organization.
- Admins can use these reports to understand usage patterns, identify trends, and track the adoption of Teams over time.
- Admins can customize columns and date range for better classification.
- Further, exporting the report into a .csv file can be made for further analysis.
- Under usage reports in the Teams admin center, admins can generate reports on Apps usage, PSTN blocked users, Teams device usage, Teams live event usage, Teams usage, Teams user activity, information protection license, virtual appointments usage, and audio-conferencing dial-out usage over the last 180 days.
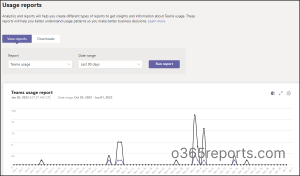
Find the overview of information on Teams usage reports available in the Teams admin center.
Teams App Usage Report – Get to know the total number of apps installed, the number of active users and teams using the app, and inactive apps in the organization. You can use this report to understand where exactly different apps are getting used and deep dive into per-app utilization data.
Teams PSTN Blocked Users Report – List of users who are blocked from making PSTN (Public Switched Telephone Network) calls in Teams can be obtained in this report. This report can be mainly used to find out the reason why the users are blocked from making PSTN calls in Teams.
Teams PSTN Minute and SMS Pools Report (Preview) – Details on PSTN calling and SMS activity in the organization based on the number of minutes consumed during the current month can be obtained from this report.
Teams PSTN and SMS Usage Report (Preview) – Admins can find details on number of minutes that users spent in inbound and outbound PSTN calls and SMS activity in the organization. Gaining insights on PSTN usage help admins to plan and make the right business decisions.
Teams Live Event Usage Report – Admins can gain clear metrics on the number of live events held in the organization from this report. Additional info on event status, starting time, views, recording setting, and more can be obtained.
Teams Information Protection License Report – Provides Teams usage insight on Microsoft Graph APIs like if the users have required license to push their messages, export Teams content, etc. Admins are also provided with the details on the total number of change notification events triggered by a user.
Teams Virtual Appointments Usage Report – Detailed info on virtual appointments scheduled using bookings app, and Electronic Health Records (EHR) can be obtained here. Further, metrics like duration of an appointment, lobby wait time, start time, attendees’ details, etc., can be seen.
Teams Audio Conferencing Dial-Out Usage Report – Admins can fetch the details on dollars spent for the audio-conferencing dial-out service. Along with the cost tab, minutes of use and dial out calls detail can be gained.
Report details on usage activity, team usage, and device usage are the same as the ones in Microsoft 365 Admin center.
Manage Analytics in Microsoft Teams Client
Even as user, obtaining Teams Analytics is possible. Wondering how? Let’s check it out.
Microsoft Teams app allows users to view analytics for the teams and channels they belong to. Three kinds of analytics can be obtained from Microsoft Teams client that includes,
- Per-team analytics
- Per-channel analytics
- Cross-team analytics.
Per-team Analytics:
A per-team analytics view shows user’s usage statistics specific to one team.
Step 1: Open Microsoft Teams.
Step 2: Pick any team you want and navigate to More options (…) –> Manage team.
Step 3: Click the Analytics tab and specify the time period.
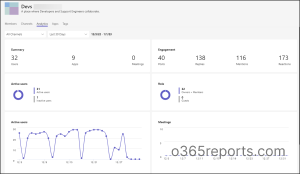
With Per-team analytics, you can:
- Obtain the summary of users, apps, meetings in a specific team.
- View the Team engagement level including number of posts, replies, mentions, reactions made.
- Find an overview of active users, inactive users, number of internal users, and guests.
Per-channel Analytics:
A per-channel analytics view shows user’s usage information for a specific channel.
Step 1: Open Microsoft Teams.
Step 2: Pick any channel from the channel you want.
Step 3: Navigate to More options (…) –> Manage Channel –> Analytics.
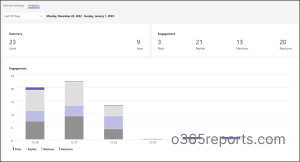
With Per-Channel analytics, you can
- Fetch the number of users and apps added to the channel.
- Find the channel’s engagement level like the number of posts, replies, mentions, and reactions made.
Cross-team Analytics:
In the cross-team analytics view, users can see usage data for all the teams they belong to.
Step 1: In teams, go to the bottom of the teams’ list and select the gear icon.
Step 2: Click on Analytics to view the Cross-team analytics of your organization.
With cross-team analytics, you can analyze the number of active users, people, guest, posts, replies across all the teams in the organization.

Microsoft 365 Teams Usage Analytics in Power BI
Using Power BI, both admins and users can analyze the Teams activity usage. Find out how.
As an admin…
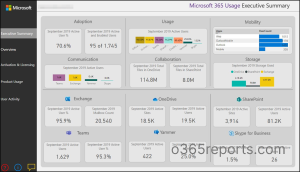
Admins can view the Teams adoption rate in the organization with the help of Microsoft 365 usage analytics content pack in Power BI. With Microsoft 365 usage analytics, admins can access pre-built reports and dashboards that provide a cross-product view of the past 12 months. To analyze and start collecting Microsoft 365 usage data, make sure that you have enabled Microsoft 365 Usage Analytics.
Once the Microsoft 365 usage analytics is enabled, creating and sharing custom reports org-wide can be done!
As a User…
Users can also analyze Teams usage by generating a report in Power BI embedded in Teams. You can view your Teams activity analytics in Microsoft Teams ensure the following criteria:
- Sign in to the Power BI service to activate your Power BI license.
- Team activity analytics can be accessed by users with a Power BI (Free) license.
- Power BI for Teams should be installed.
Let’s take a look on how users can generate Teams activity analytics in Power BI.
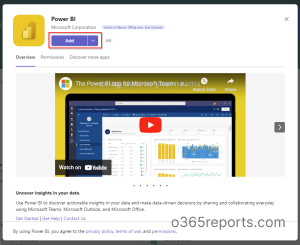
Step 1:
Go to apps in Teams client and add Power BI.
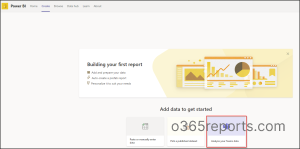
Step: 2
Navigate to Create –> Analyze your Teams data.
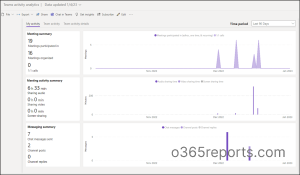
Step 3:
Your Teams activity analytics will get generated which can be shared and exported now. You can also edit the report based on requirements.
To check Microsoft Teams call quality, you can use PowerShell. It will be useful to monitor audio, video, and network issues that occur during Team meetings.
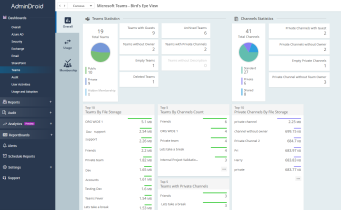
Manage Microsoft Teams Usage With AdminDroid
The need to search and goof around Teams usage in various places would cause hassle during urgent investigation. To clear the air, make use of AdminDroid, an Office 365 reporting and auditing tool.
AdminDroid, a user-friendly tool, comes with advanced filtering, quick scheduling, aesthetically attractive visual capabilities, and intelligent searching features that assist admins in obtaining overall Teams usage reports promptly without delay.
You may wonder, how? AdminDroid Reporting tool includes extensive reports on Teams usage under:
- Teams Usage Statistic Reports – Get an overview of how users are engaged in Microsoft Teams, including how many calls, messages, team chats, and other activities were performed.
- Teams Device Usage Reports – Information about various device types, employees use to connect to Microsoft Teams is gained.
- Teams Inactive User Reports – Statistics on Teams’ inactive users based on users’ last team chat, last private chat, and meeting history are shown.
- Daily Summary of Teams Activity Reports – Admins can fetch detailed summaries on active devices, user activities, and active users by activities.
- Teams Management Reports – Metrics on team creations, channel deletions, shared channel creations, and private channel creations can be obtained.
Apart from this, AdminDroid also provides an exclusive analysis of Microsoft Teams Usage and Adoption in the organization.
To track usage and adoption rates for Microsoft Teams, you can use AdminDroid’s login activity audit data available. With the Teams login report, the number of active users, and total logins for the selected time period can be obtained. Unlike a high-level glance, admins are provided with a scrutinized view of active users and their key activities along with charts, and graphs for each attribute such as department, job title, city, state, country, and company name specifically.
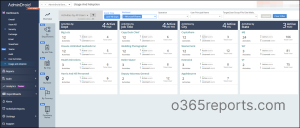
No need for pit stops when you are using AdminDroid. Manage your entire organization’s administration with a single tool. Download AdminDroid Microsoft 365 reporting tool and explore the Teams Usage Reports on your own.
I hope this blog helped you in finding all the possible ways where admins can find the Teams usage report of their organization. By analyzing Teams usage data admins can identify areas where productivity may be lacking and can come up with ways to boost engagement among a particular team or channel if they aren’t seeing much activity.


